mapping
Introduction to Mapping using QGIS
| «< Previous | Next »> |
Additional Layers and Ideas for Analysis
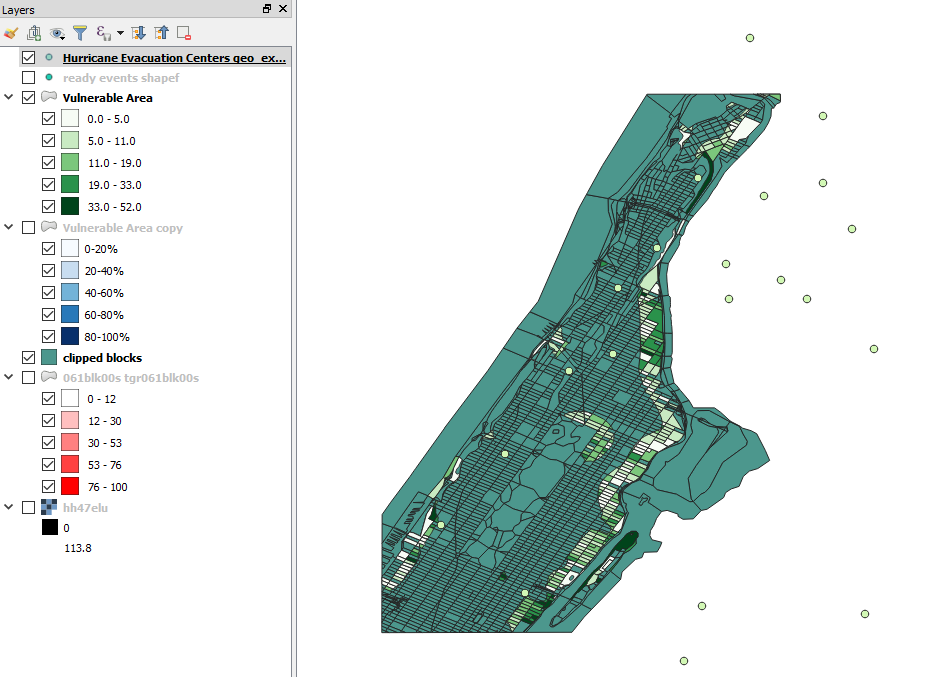
Now that we have visualizations of some of the types of populations within the vulnerable areas, we can add other layers and analyze the relationships between population and the data in these other layers. For this example, we will look at a layer of Hurricane Evacuation Centers in New York City. Are these centers capable of sheltering all of the population in the vulnerable areas?
Opening the Hurricane Evacuation Centers layer, we see the following:
We can remove the points that are outside of the study area by Clipping it with the “Clipped Census Blocks to Study Area” layer (Just like we clipped other layers before). However, when you try to do it, you might get this error:
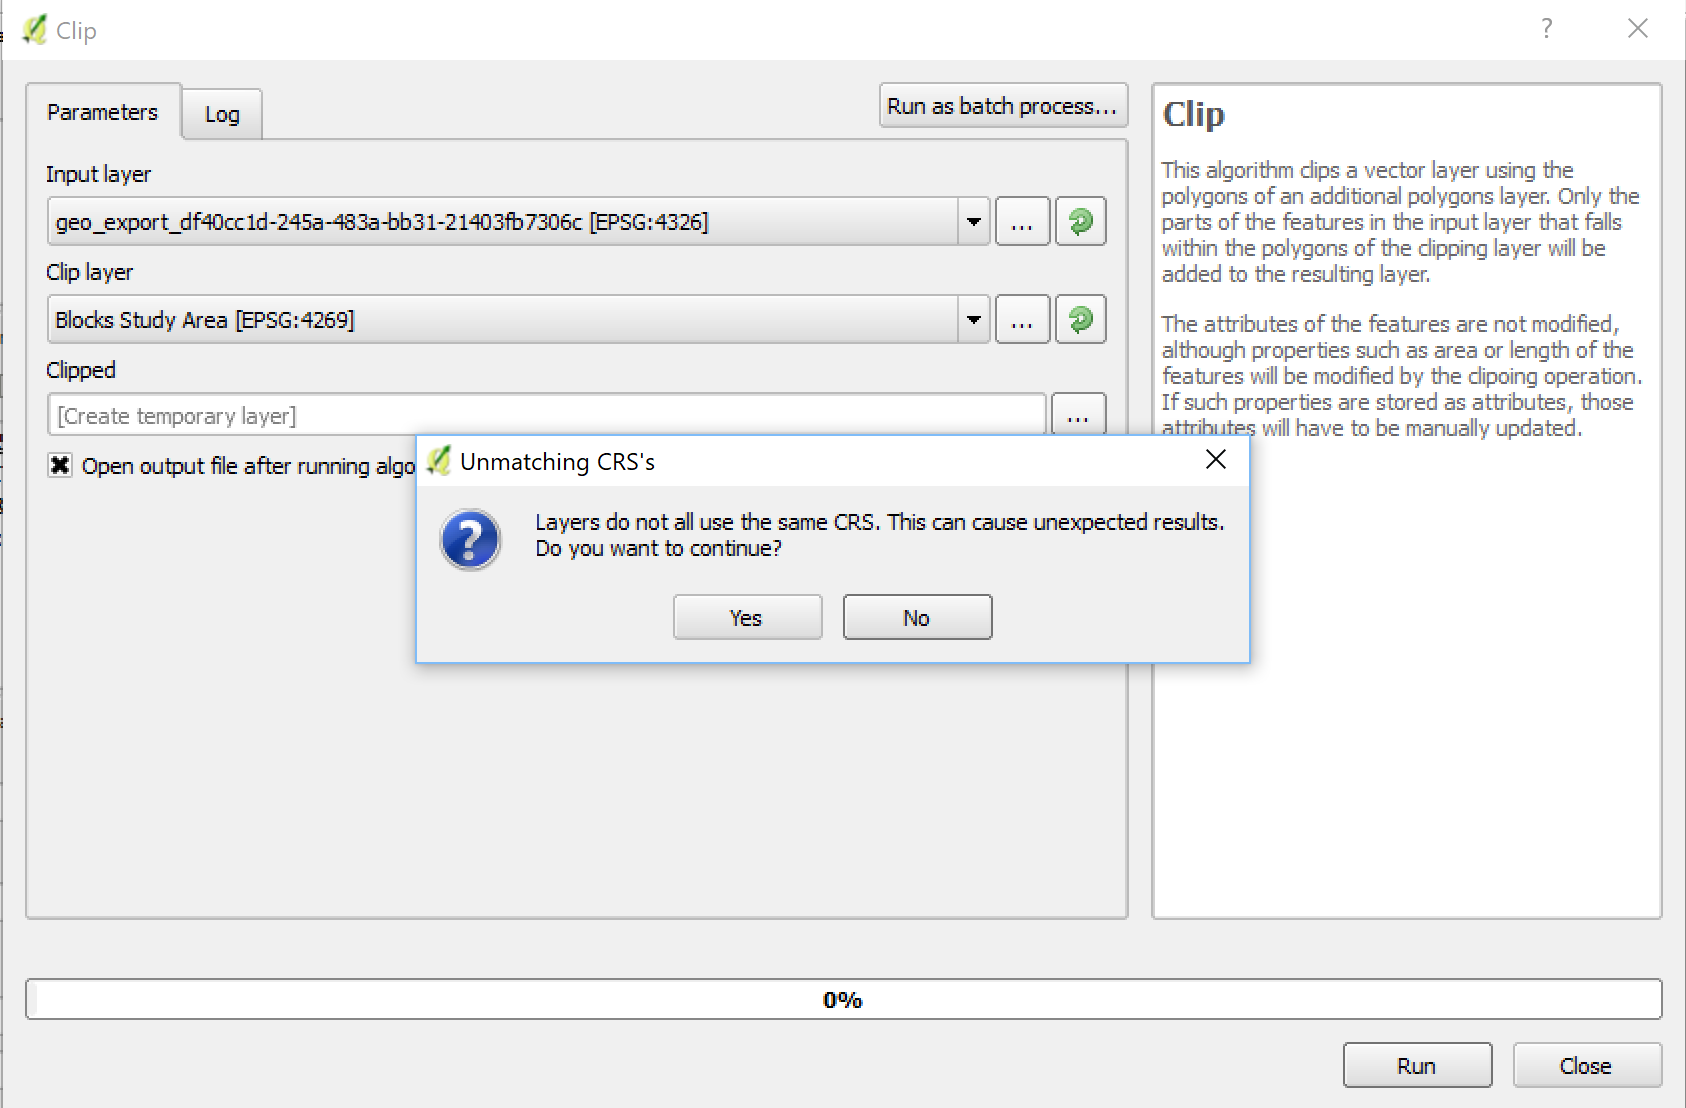
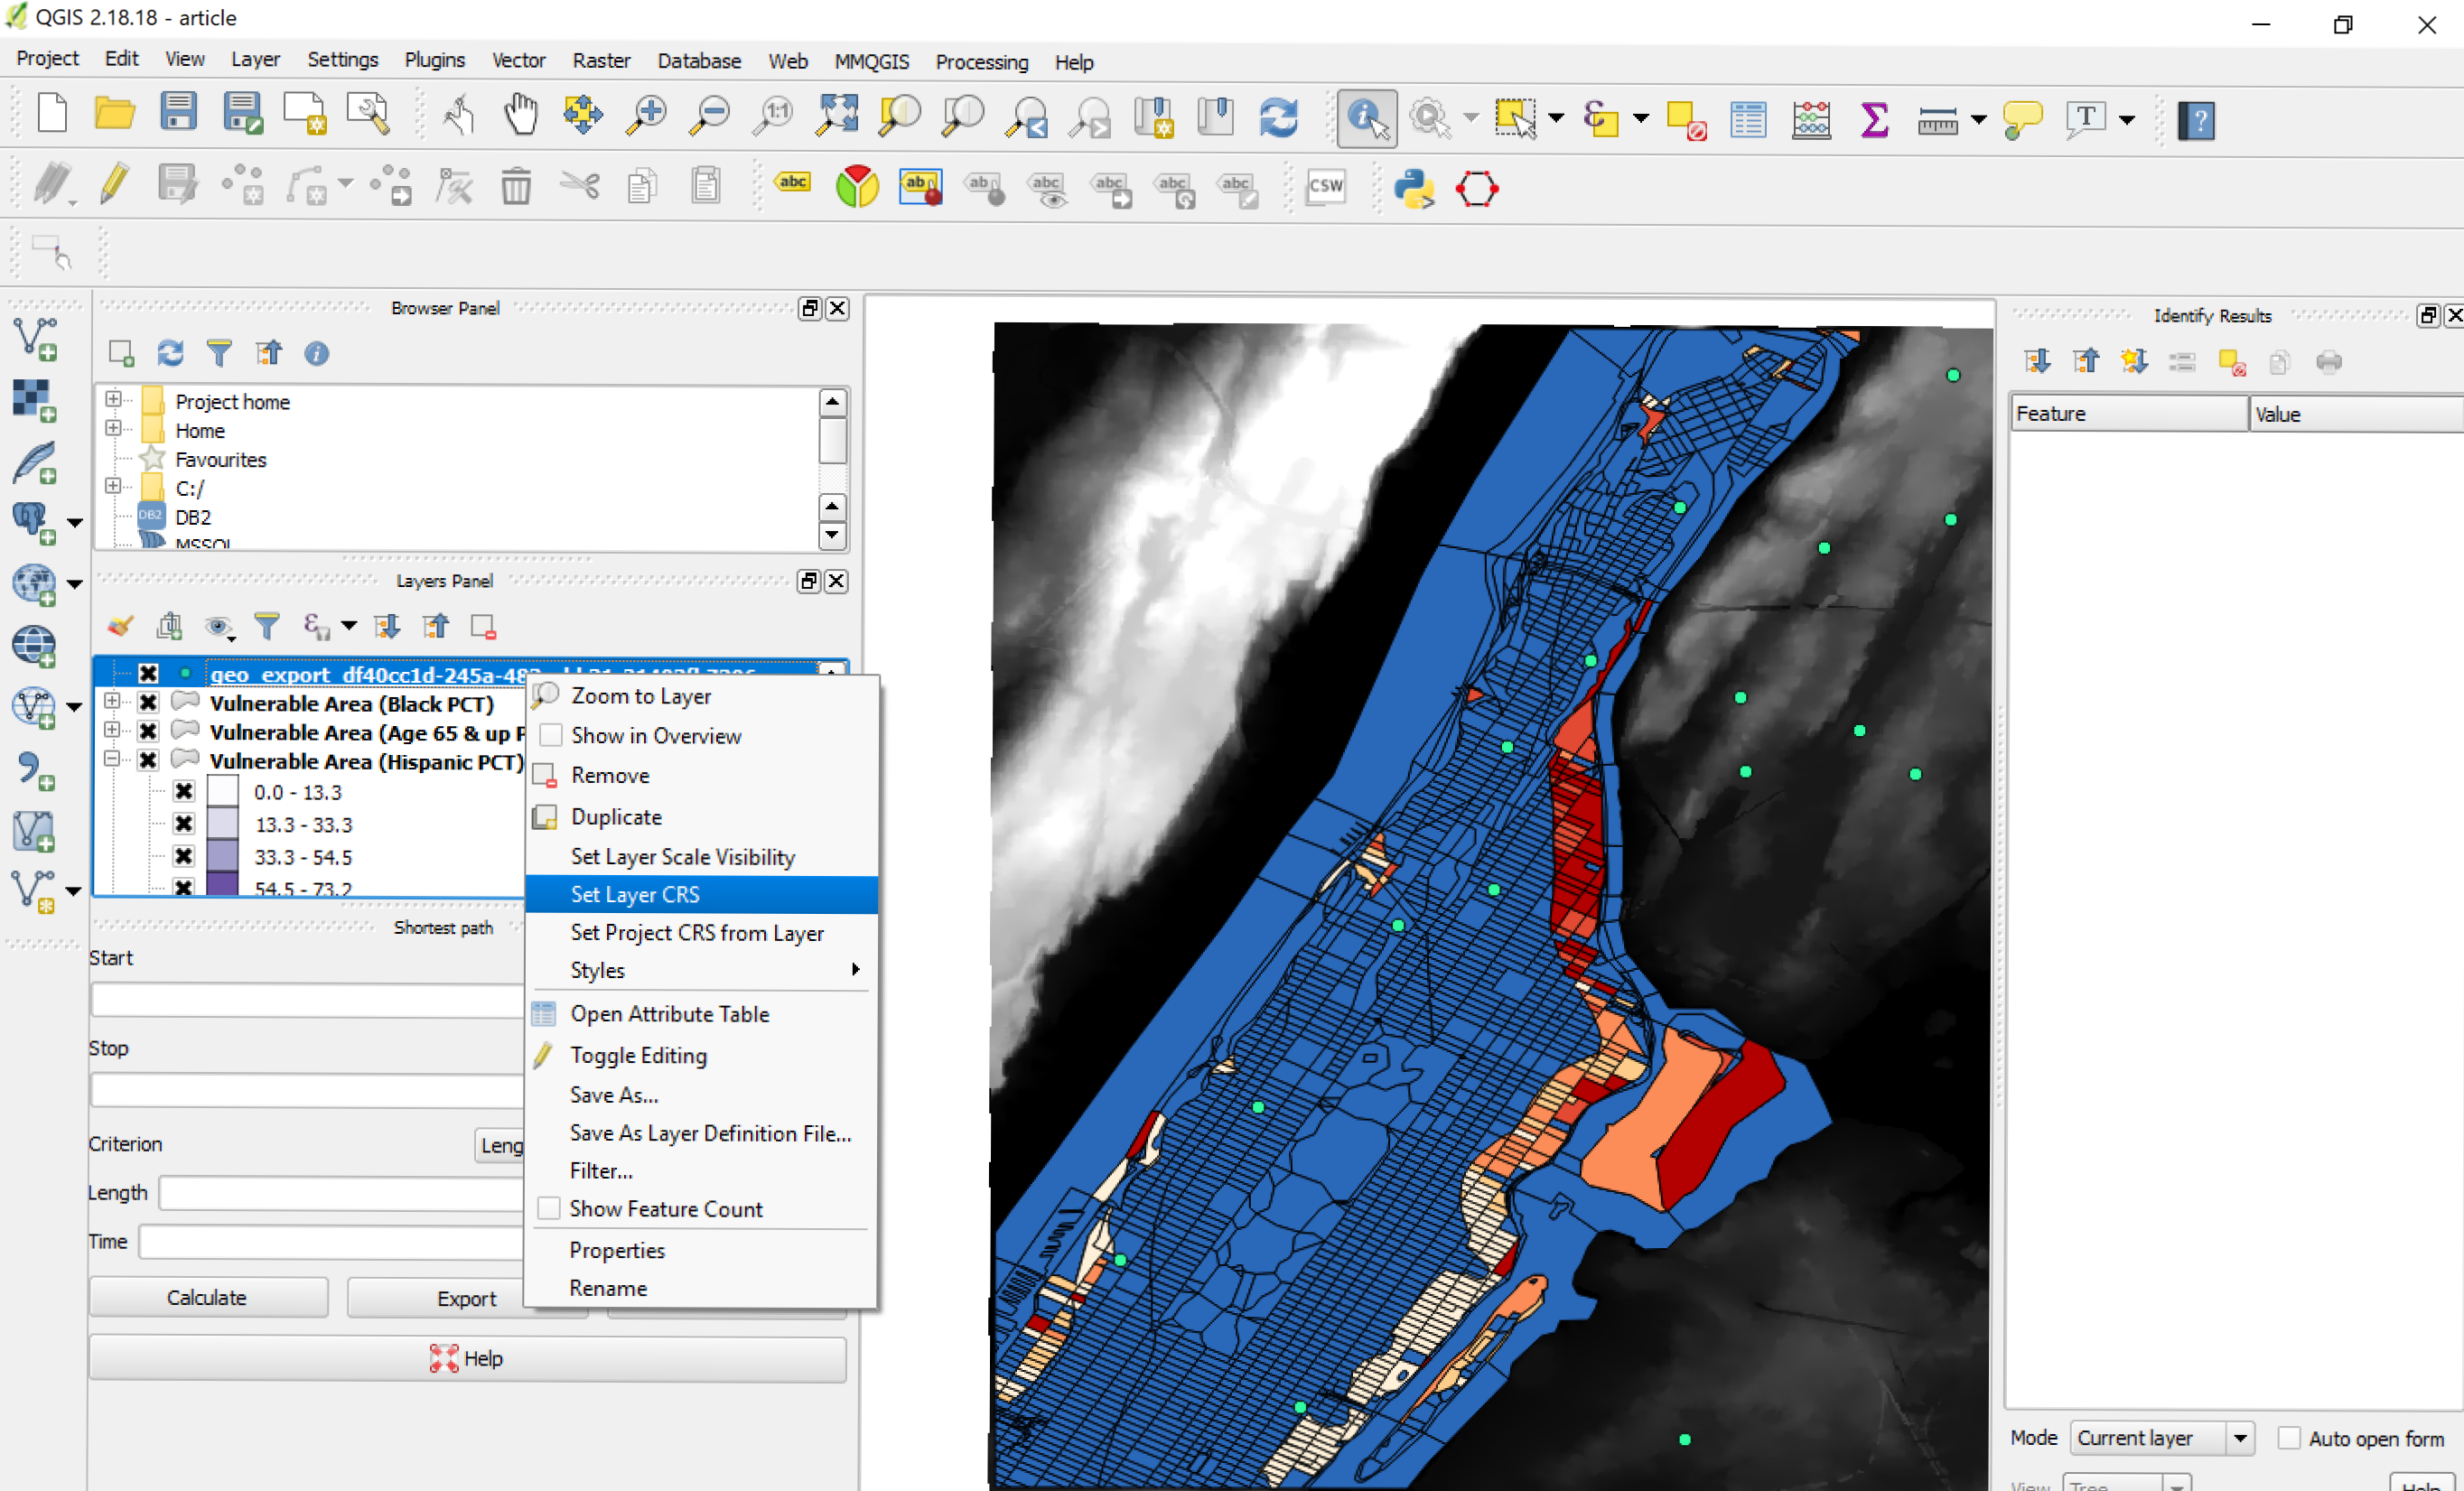
When you get this error, know that whenever QGIS warns that there may be unexpected results, it means there WILL BE unexpected results. To avoid this you need to set the layer CRS to the project’s. To do it:
- Right-click on the layer.
- Click on
Set Layer CRS. - Select the appropriate CRS (EPSG:4269).
Note: Sometimes setting the CRS this way won’t work, then you have to “Save as…” and choose the proper projection from the Save dialog box.
Now you can run the Clipping tool. Note that there are some centers that are within the study area, but are not in Manhattan, so it’s best to use the layer of the Blocks in the Study Area to clip the Hurricane Evacuation Centers. Once you do, rename this new layer “Evacuation Centers in Study Area”, and open the Attributes Table. You will notice that there are only eight centers for the whole population. Here are some ideas of types of anaylsis you could do:
- You can divide the total vulnerable population by 8 to know how many people are expected to be sheltered in each of these Evacuation Centers.
- You could also create a 500-meter (1640.42 feet) buffer around to determine whether the centers are at a walkable distance for all the vulnerable population (see note below about creating buffers). Take closer attention to neighborhoods with high percentage of people 65 and up, who could have higher chances of difficulties to walk long distances.
- Note that in the Attributes Table only four of the centers are “Accessible”. Change the visualization of this layer to a Categorized version, where a color represents accessible centers (green) and another color represents non-accessible (red).
About creating buffers
Something important that you need to know is that QGIS works in “map units”, determined by the project’s CRS (that’s why to avoid this, we used the MMQGIS plugin earlier). For geospatial operations to be done properly, all layers involved must be in the same CRS, and this CRS is ideally the same of the project. Some CRS use degrees as units, some use meters, or feet, or miles. If you are working with a CRS that uses degrees, such as EPSG:4269, a trick to do buffers properly is to save your dataset into a CRS that uses your desired unit (for example, EPSG:102718 is a proper projection of NYC that uses feet), then change your project’s CRS to the same one than the layer, and then do the buffer, and “Save as…” a layer in the original CRS of your project (in this case, EPSG:4269). Then revert your project to the original CRS and you will have the properly projected buffers.
Comparing layers
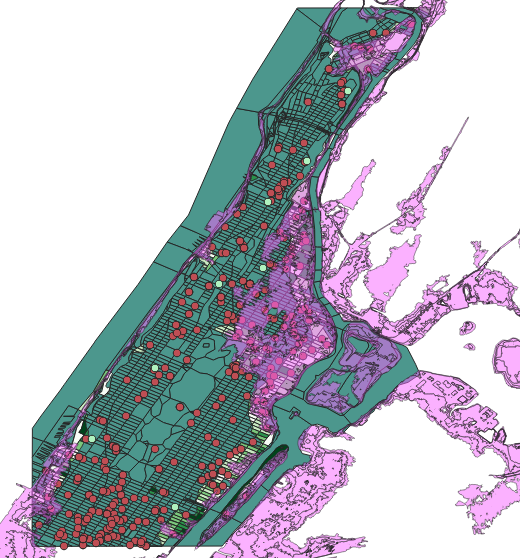
A final layer that we can overlay with our data is the one of Hurricane Inundation Zones - Worst Case. This is a layer prepared by USGS to determine what areas could potentially be affected in the case of Hurricanes (basically what we did, but with a more complex algorythm).
Here are some ideas to use this layer:
- Change its opacity to 50% in the Symbology and lay it over the Vulnerable areas. Does it correspond to the area that we identified? If not, what could be the reason?
- Open the attributes table. You will notice a column called “Category”. This refers to the category of hurricanes. If we select categories 1 & 2, we can notice that the selected area resembles the Vulnerable Area of our study, so perhaps our simulated event was in fact equivalent to a Category 2 Hurricane.
- Note that due to the complexity of this layer, operations such as Clipping will take much longer. Since we are only using this layer for comparative purposes, there is no need to clip it to our study area. We can just turn the layer off once we are done comparing.
Adding a Basemap
A useful tool for mapping, especially if you are starting from scratch or specific streets are important, is to use a basemap to add context to your points, lines, and polygons in space. Let’s learn how to add a basemap.
- Click on plugins in the top toolbar and select “manage and install plug-ins”
- Search for “QuickMap Services” and install
- On the top toolbar, select the globe that says “quickmap services” when you hover over it with your cursor
- Choose your basemap—all are fine, but each looks a bit different. For this project, we will use OpenStreetMap (OSM).
As you may notice, there are many basemap options, including those with bike lanes. If you want to keep your basemap, change the opacity of your census layer so that you can see it more clearly.
| «< Previous | Next »> |